
A volume bar on a CFD chart is not necessarily a count of contracts traded on the underlying exchange. Retail CFDs are generally over-the-counter contracts with broker-specific quotes, while an exchange reports trades executed in its own market. Depending on the platform and product, a displayed ‘volume’ figure may be a count of quote updates, broker-supplied activity or notional customer turnover. The data source and unit matter more than the label.
A CFD Is Not the Same Trade as Its Underlying Asset
A contract for difference gives a customer economic exposure to price movements in an underlying asset without necessarily buying or selling that asset itself. A retail CFD is typically an over-the-counter contract with a provider. The provider may derive its price from an exchange-traded share or future, from several liquidity sources, or from a calculated index. The customer trades the CFD under the provider’s contract; the underlying exchange records only the trades actually executed in its own market.
This means there can be several different quantities that people casually call ‘volume’: the number of CFD contracts traded by customers, the notional value of customer orders, the number of times a broker updates its quote, the size of the broker’s hedge transactions, and the number of shares or futures contracts traded on an exchange. They measure different activity. A broker can process substantial customer turnover while internally offsetting opposing positions and sending only the residual exposure to an external market.
The European Commission defines an OTC derivative as a privately negotiated derivative that is not traded on an exchange. MetaTrader’s official documentation makes the platform-level difference explicit: exchange-mode charts can use last-traded prices and actual deal volumes, while OTC charts may be based on bid quotes and tick counts; real trade volume may not be available for OTC symbols. [1][2] The first question to ask about any volume number is therefore: what exactly was counted, by whom, and in which market?
Tick Volume Counts Quote Updates, Not Lots or Shares
On many retail FX and CFD charts, especially in MetaTrader 4 and many OTC symbols in MetaTrader 5, the volume histogram represents tick volume. A tick is a price update received by the platform. If the quote changes 1,200 times during a five-minute bar, the tick-volume value may be 1,200. It does not mean 1,200 contracts or lots changed hands, nor does it reveal the value of the transactions behind those updates.
Tick volume can still be useful. More quote updates often coincide with more active market conditions, and a trader can compare tick activity over time on the same feed. But the measure depends on the feed. Two brokers can receive prices from different liquidity providers, aggregate sources differently, filter repeated updates or publish quotes at different frequencies. Their bars may therefore show 1,200 and 760 ticks during the same interval even if both track EUR/USD closely. Neither count is a consolidated total for the global FX market.
TradingView similarly notes that some Forex and CFD symbols do not have trade-volume data, while some may have tick volume only; for its own TVC-branded CFDs, TradingView says it does not calculate volume. MetaTrader distinguishes tick volume from real volume and warns that real volume may be unavailable for OTC markets. These are platform-specific rules, so a trader should check the selected symbol’s data source rather than assume every indicator uses exchange transactions. [3][4]
This is also why a volume-profile indicator can be misleading on an OTC CFD. Some volume-profile tools distribute the supplied volume across price levels within each bar. If the input is tick count, the result describes where quote updates occurred, not how many contracts were executed at each price. It may still identify areas of frequent price interaction on that particular feed, but it should not be labelled an exchange volume profile or treated as evidence that a specific amount of institutional capital traded there.
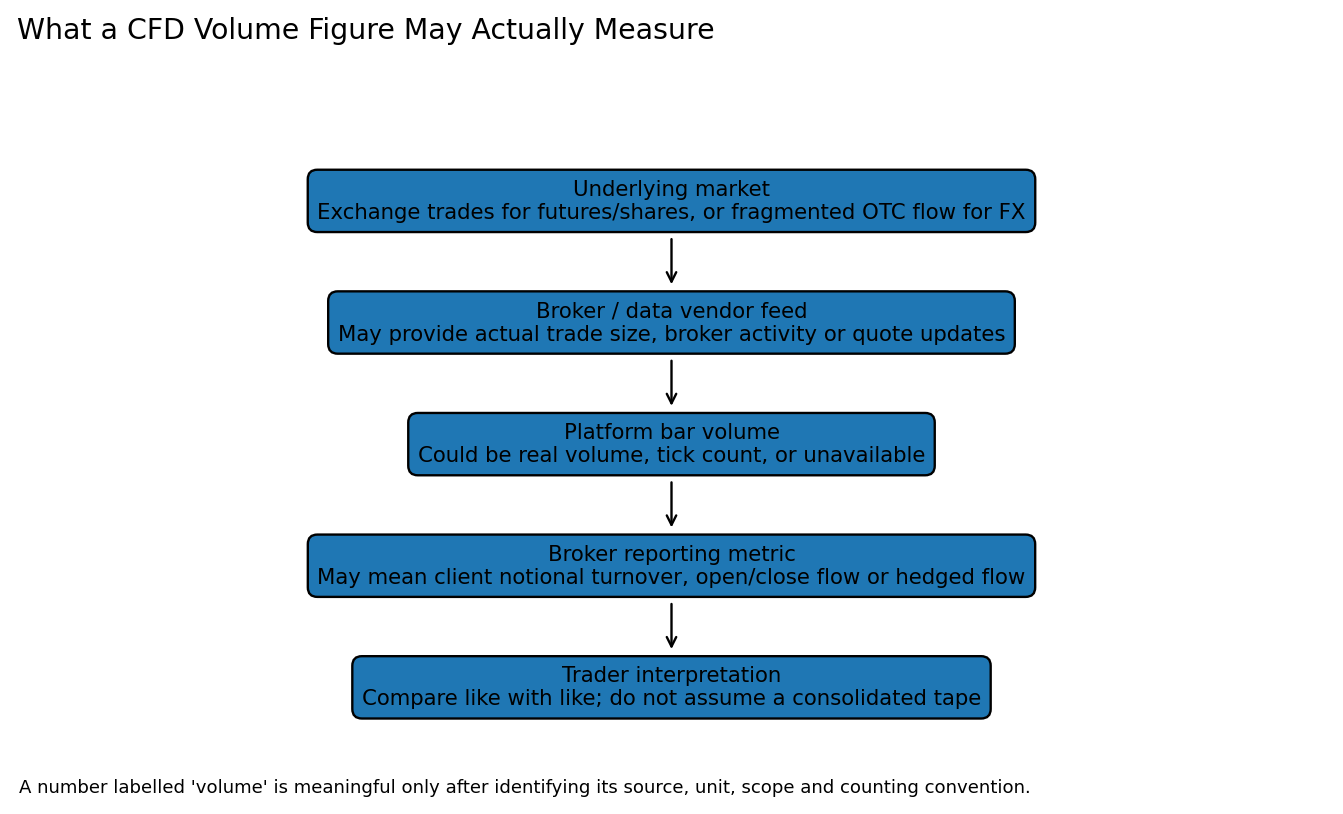
Figure 1. A CFD volume number may originate at several different layers between the underlying market and the broker’s reporting system.
Why Exchange Volume Is a Different Type of Evidence
An exchange records executions in a defined market. For an exchange-traded future, the exchange’s daily volume report counts contracts traded across the venues and execution types included in that report. CME Group, for example, publishes daily and historical volume and open-interest reports for its futures and options. The unit is tied to the contract: a volume of 50,000 means 50,000 contracts, not 50,000 quote changes. Open interest is different again; it counts outstanding contracts that have not been offset or otherwise closed according to the exchange’s methodology. [5]
An equity CFD can reference a listed share whose exchange has genuine share volume. But the CFD contract itself does not automatically enter the exchange’s share-volume total. If a customer buys 100 share CFDs, the broker may hedge by buying shares, hedge a net exposure across multiple customers, use a related derivative, or retain some exposure within limits. The underlying share trade, if one occurs, is a separate transaction and may not match each retail CFD ticket one for one.
The distinction becomes sharper for index CFDs. A cash index is a calculated index level rather than a single instrument with its own shares traded. A broker may hedge index exposure using futures or a basket of constituent shares. The futures exchange reports the futures contracts actually traded; it does not report the retail CFD contracts between customers and their broker. Comparing the two totals as though they were identical markets confuses a reference price with a transaction venue.
The Four Numbers Hidden Behind the Word ‘Volume’
First, quote activity: tick volume counts price updates during a chart bar. Second, underlying exchange volume: shares or futures contracts actually executed on a particular exchange or set of venues. Third, CFD client turnover: the number or notional value of client CFD transactions recorded by a broker. Fourth, external hedge turnover: the transactions the broker or its risk-management counterparties use to offset residual market exposure. A report may use another definition, so the label alone is not enough.
Consider a hypothetical client who opens a $500,000 notional CFD position and later closes it. If the broker’s statistic counts gross notional turnover for both legs, the opening contributes $500,000 and the closing another $500,000, producing $1 million of turnover even though the maximum open notional exposure was $500,000. If the broker offsets the position internally or netting reduces the need for external hedging, its external hedge turnover can be lower still. This does not make the reported customer turnover false; it means the metric answers a different question.
Volume statistics can also be reported in contracts, lots, units, notional dollars, number of orders or number of executed tickets. A $10 million notional trade in a high-priced share CFD is not comparable with 10 million shares traded on an exchange. Even two brokers reporting ‘trading volume’ may use different asset coverage, gross-versus-net conventions, opening and closing legs, currencies and reporting periods. The methodology note is part of the metric, not an optional footnote.
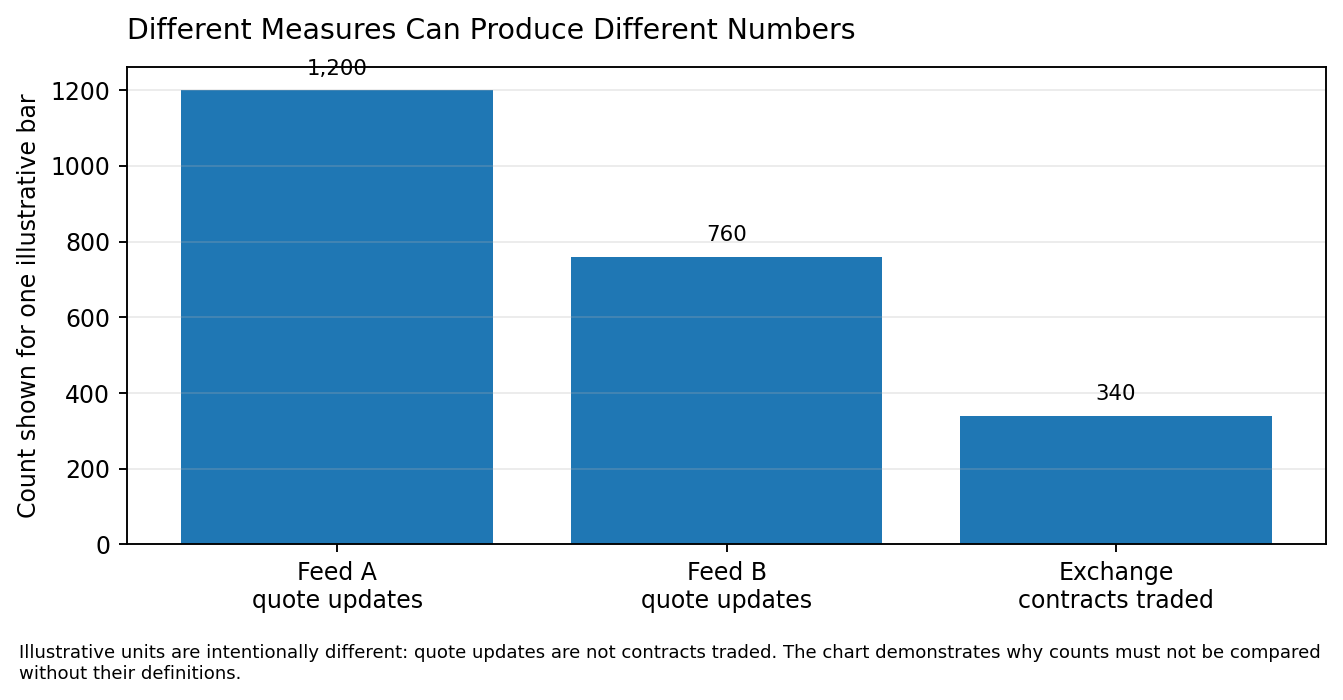
Figure 2. The counts are deliberately shown in different units: quote updates and executed contracts should not be compared as if they were the same quantity.
Illustrative Comparison
| Metric | What it counts | What it does not automatically count |
| Tick volume | Quote updates received during a bar | Lots, shares or contracts executed |
| Exchange volume | Executed contracts or shares in a defined exchange report | Retail CFD tickets referencing the same market |
| CFD client turnover | Broker-defined client transactions or notional activity | Total underlying exchange turnover |
| Broker hedge volume | External trades used to offset residual risk | Every customer trade one-for-one |
| Open interest | Outstanding exchange contracts under the exchange’s definition | Trading activity during the period |
The labels are not interchangeable. Always identify source, unit, instrument, scope and whether figures are gross or net.
Why FX Volume Is Especially Difficult to Consolidate
Spot foreign exchange is not a single exchange with a consolidated tape covering every bank, dealer, electronic venue and customer. The BIS describes the FX market as decentralised and fragmented, with trades occurring over the counter through direct dealer relationships and a range of electronic platforms. Its 2025 Triennial Survey estimated global OTC FX turnover at roughly $9.5 trillion per day in April 2025 across instruments, up from $7.5 trillion in April 2022. That figure includes spot, forwards, swaps and options; it is not a retail CFD volume total. [6][7]
The BIS also highlights internalisation: dealers match opposing customer trades within their own books rather than immediately trading every transaction externally. In its 2025 analysis, internalisation ratios were above 80% across major FX trading hubs, and G10 ratios were higher in some cases. That means customer turnover can be substantial while the dealer’s external hedge transactions are much smaller. The external market sees the residual that needs to be hedged, not necessarily every customer ticket.
An FX CFD adds another layer because the customer is trading a contract with a broker, not necessarily a deliverable spot currency transaction. The broker may construct its quote from several banks or liquidity providers and manage customer risk internally. Therefore, the tick volume on one broker’s EUR/USD chart cannot be multiplied or extrapolated to estimate global FX turnover. It is a feed-level activity measure unless the provider explicitly supplies a different verified volume dataset.
How Volume Differences Can Mislead a Trading Strategy
Volume-based indicators can be useful when the input is consistent, but a trader should not interpret every spike as institutional buying or selling. A tick-volume spike may mean quotes are updating quickly because volatility has increased. It does not by itself reveal whether buyers or sellers initiated the underlying trades, how much notional was exchanged, or whether a dealer internalised the flow.
Nor does a large broker-reported CFD turnover figure prove that the same amount of underlying shares or futures changed hands. The broker may count opening and closing tickets, customer flow may be offset internally, and only residual exposure may be hedged externally. If a platform says a CFD market saw $2 billion of ‘volume’, the trader needs to know whether that means notional customer turnover, units, a provider’s feed or actual exchange executions. Without that definition, the number cannot support a precise inference about market participation.
Volume comparisons are also sensitive to the chosen time interval, timezone, session, contract month and feed. A futures contract’s volume often migrates from the expiring contract to the next one around a roll. An index CFD may continue quoting when the cash index is closed by using futures or a derived price. A broker’s tick count can remain active in that period while the primary cash market records no new trades. Comparing those bars without aligning the instrument and session can create a false signal.
A volume-based backtest can therefore be sensitive to the broker chosen for the data. If the entry rule depends on tick volume exceeding its 20-bar average, changing the provider can alter the number of qualifying signals even when price candles look similar. The test may be learning the provider’s quote-publication pattern rather than a stable market property. Robust testing should compare several feeds, use consistent timestamps and explicitly document whether the input is tick count or executed volume.
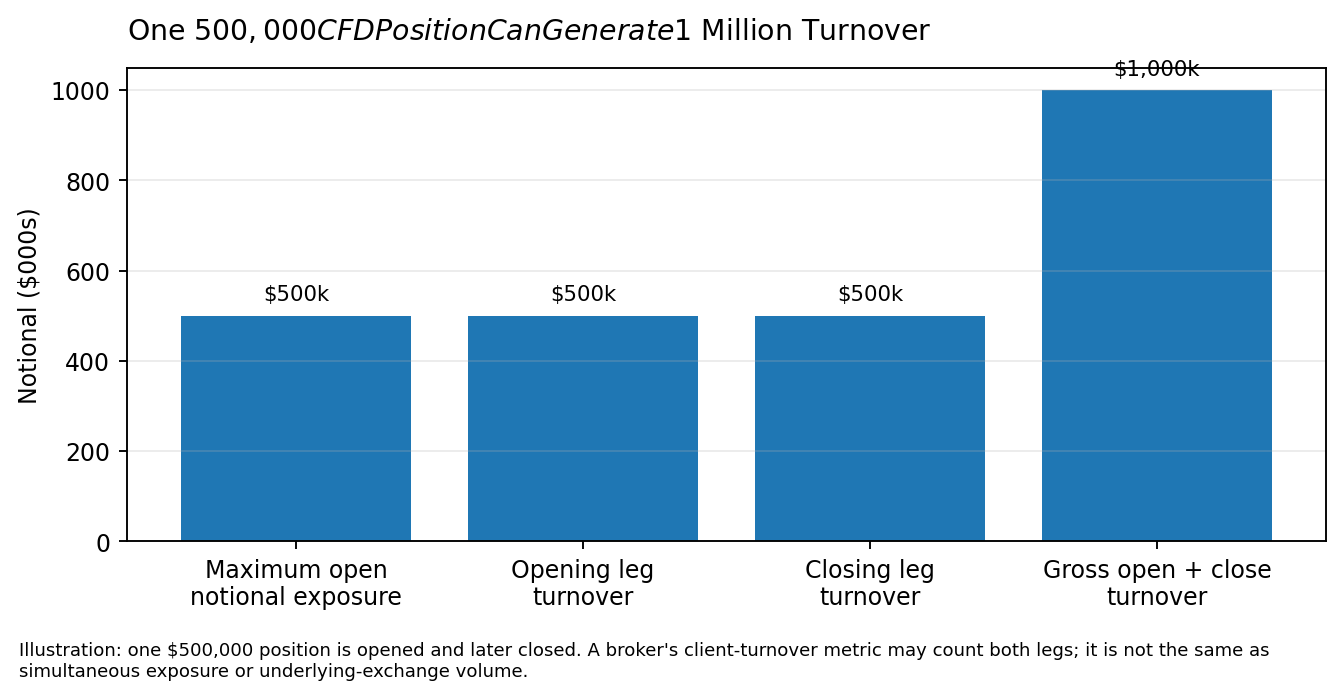
Figure 3. A single $500,000 CFD position can create $1 million of gross opening-plus-closing notional turnover without $1 million of simultaneous exposure.
A Better Framework for Comparing CFD and Exchange Activity
Start by identifying the exact instrument behind the chart symbol. Is it a share CFD, cash index CFD, futures CFD, rolling spot FX CFD or an exchange-traded future? Confirm whether the provider displays bid, ask, midpoint or last-traded prices, and whether the volume field is tick volume or actual trade volume. The platform’s help page, broker symbol specification and data-provider notes should answer those questions.
Next, write down the unit and scope. Does the number count quote updates, contracts, lots, shares, client tickets or notional value? Is it gross or net? Does it count both opening and closing transactions? Does it cover one broker, one venue, a group of exchanges or the global market? If the provider cannot define the metric, treat it as a platform-specific indicator rather than an authoritative market total.
Finally, compare like with like. For an exchange-traded future, use the exchange’s volume and open-interest reports for the correct contract and date. For a CFD, treat the broker’s quote and tick data as evidence about that feed, and use an independently sourced underlying-market series for broader activity. Dave Finances’ analysis of how forex brokers hedge client trades explains why customer flow and external hedge flow can diverge. The article on why most retail CFD traders lose money also shows why execution conditions matter more than an unqualified volume label.
What Broker Volume Claims Can and Cannot Establish
Broker-reported turnover can still be useful for analysing a company’s scale, revenue model or customer activity. For example, an annual report may disclose client notional volume, customer trading income, average revenue per active customer or the split between OTC and exchange-traded products. Those measures can reveal business growth and monetisation when the definitions remain consistent over time. But they should not be presented as direct evidence of underlying exchange liquidity unless the report explicitly defines them that way.
Public disclosures often show why the measures differ. IG describes its OTC business as a principal model in which the firm is counterparty to customer trades, offsets opposing positions and hedges residual exposure. Plus500’s annual report distinguishes OTC customer income from non-OTC commission income and describes customer trading performance as part of trading income. These disclosures help explain that a broker’s business metrics can be about customer contracts and the firm’s resulting P&L, not simply the volume printed by an exchange. [8][9]
The most defensible article or trading analysis therefore names the metric precisely. Use ‘tick updates on Broker A’s EUR/USD feed’, ‘CME E-mini S&P 500 contracts traded’, or ‘broker-reported client CFD notional turnover’ instead of the vague word ‘volume’. That small wording change prevents a large category error and makes charts, strategy tests and market comparisons more reproducible.
Reported company turnover also needs a denominator. A broker can report a large notional amount because customers use leverage, trade frequently or open and close positions repeatedly; the figure does not mean the broker holds that amount of cash or that the same amount of underlying assets changed hands. To evaluate growth, compare the same firm’s metric across periods and read the accompanying definition, asset coverage and risk disclosures. For cross-company comparisons, avoid ranking brokers by turnover unless their reporting conventions are genuinely comparable.
How to Read a Volume Chart Before Trading
Before using a volume indicator, identify the exact symbol and data source. A chart labelled EUR/USD may be a broker’s rolling OTC CFD, a third-party indicative feed or a futures contract with a different market structure. Confirm the session timezone, bar interval and whether the data field is tick volume or executed trade quantity. If the source cannot explain the field, do not use it as a quantitative proxy for total market participation.
Then test whether the indicator is stable across providers. Compare the timing of spikes, not just their absolute values, and run a sensitivity test using a second feed. If a strategy’s results collapse when the tick count changes but prices remain broadly similar, the strategy may depend on the data provider’s update behaviour rather than a robust market signal. For exchange-traded contracts, use the correct exchange contract and roll convention; for CFDs, label the feed-specific measure accurately.
Finally, keep volume evidence separate from direction. A high count of price updates can occur in a sharp sell-off, a rally, a two-way whipsaw or a period when spreads are widening. Volume alone does not tell you whether a market is bullish, bearish or liquid enough to absorb your order. Combine it with executable bid-ask prices, depth where genuinely available, volatility and a clear execution plan.
The Bottom Line: Ask What the Number Counts
CFD volume differs from real exchange trading volume because the two figures often describe different things. An exchange reports executed trades in its own market. A retail CFD platform may show quote updates, broker-specific activity or a data feed with no consolidated transaction tape. A broker’s customer turnover can include both the opening and closing legs of positions, while external hedging may cover only the net exposure left after internalisation.
That difference is not automatically a flaw. Tick volume can be a useful proxy for activity on one feed, and broker turnover can be a valid business metric. The mistake is treating either as a universal measure of how many shares, contracts or currencies the entire market traded. The source, unit, scope and counting method must be known before the number can be compared or used to infer market demand.
For a retail trader, the practical rule is simple: use exchange volume to analyse the relevant exchange-traded contract, use tick volume only as a feed-specific activity proxy, and read broker turnover disclosures as company metrics. When the definition is unclear, do not assume that a large volume bar means large institutional buying, that two brokers’ tick counts are directly comparable, or that CFD customer activity must have been matched by an equal trade in the underlying market. Dave Finances’ guide to retail FX trading losses explains why misreading market structure can turn a seemingly objective signal into a misleading trading assumption.
Methodology
The $500,000 opening-and-closing example assumes a single position whose full notional is opened and later closed, and a hypothetical broker metric that counts gross notional turnover on both legs. Tick-volume examples are illustrative and do not represent measured broker feeds. The article uses MetaTrader and TradingView documentation for platform definitions, CME reports for exchange volume, BIS data for OTC FX market structure and official broker reports to distinguish client turnover from underlying-market activity. BIS April 2025 FX turnover includes multiple OTC instruments and must not be treated as CFD volume.
Sources
- MetaTrader 5 Help, Price Data and Chart Formation
- European Commission, OTC Derivatives and EMIR
- TradingView, Volume Indicator Data Availability
- TradingView, How Real-Time Data Sources Affect Trading
- CME Group, Volume and Open Interest Reports
- BIS, Global FX Markets When Hedging Takes Centre Stage, December 2025
- BIS, FX Trade Execution Landscape Through the 2025 Survey
- IG Group, Annual Report 2025
- Plus500, Annual Report 2025
- FCA Handbook, COBS 11.2A Best Execution
- CMC Markets, Annual Report and Financial Statements 2025

Johan Shamshad is Editor-in-Chief at Dave Finances, covering financial markets, digital assets, trading platforms, brokers, fintech, payments and regulation. Since 2023, he has also worked as an editor at Gulf News, the UAE English-language newspaper published by Al Nisr Publishing LLC. His work focuses on market-moving developments, company disclosures, regulatory changes and trading infrastructure, with an emphasis on primary-source verification and practical context for traders and investors.