
Bitcoin is trading at a critical point. The price has reclaimed the low-$80,000 area, but the market has not yet confirmed a clean breakout. The current structure is bullish enough to keep upside targets alive, but not strong enough to ignore the risk of rejection near overhead resistance.
The key issue is whether Bitcoin can turn the $80,000–$82,000 region from a breakout area into support. If it can, the next target sits near $85,000, followed by $90,000. If it fails, the recent move risks becoming another relief rally inside a wider corrective structure.
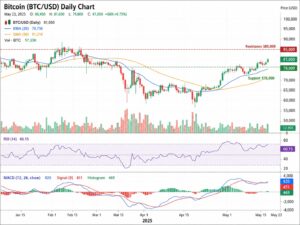
[Chart 1: Bitcoin daily price chart showing recovery from the recent base, with resistance at $82,000–$85,000 and support near $78,000–$80,000]
The Market Is No Longer Trading Like a Broken Chart
Bitcoin’s latest move is different from the failed rebounds seen earlier in the correction. The price has pushed back above a key psychological level, short sellers have been pressured, and buyers have started to defend dips rather than chase panic exits.
That matters because market behavior changes before the chart fully confirms it. In a weak market, rallies are sold quickly. In a recovering market, dips become shallower, consolidation tightens, and resistance levels are tested repeatedly until one side gives way.
Bitcoin is now in that second phase.
The market has not entered a full momentum breakout yet, but the tone has improved. The move above $80,000 gives bulls a stronger base. A daily close above $85,000 would be more important because that would show acceptance above the current supply zone.
ETF Demand Is the Main Fundamental Support
The strongest fundamental driver remains spot ETF demand. When ETF inflows strengthen, Bitcoin gets a cleaner demand channel from institutional and advisory money. This is different from purely speculative futures activity because spot ETF demand absorbs real supply.
That does not mean every inflow immediately pushes BTC higher. But over time, steady ETF buying tightens available supply, especially when long-term holders are not aggressively selling. This creates a supply-demand imbalance that can support higher prices even when macro conditions are not perfect.
ETF demand also changes the structure of Bitcoin cycles. In earlier cycles, retail speculation and offshore leverage played a larger role. Now, spot ETF flows give the market a more traditional institutional layer. That makes Bitcoin more sensitive to portfolio allocation decisions, risk appetite, bond yields, liquidity conditions, and macro hedging demand.
The positive point is simple: ETF demand has returned. The cautious point is also simple: it needs to continue. A few strong inflow days can spark momentum, but a sustained move toward $90,000 or higher needs persistent spot demand.
Macro Is Still the Biggest Risk
Bitcoin is benefiting from improved risk appetite, but the macro backdrop is not fully bullish. Interest-rate expectations remain a problem. If traders believe the Federal Reserve will keep rates higher for longer, speculative assets usually face a tougher environment.
Bitcoin can rally in that environment, but it needs stronger internal demand to do so. That is the difference between a liquidity-driven bull market and a supply-demand-driven recovery. The current move looks more like the second.
Higher rates reduce the appeal of non-yielding assets. They also make investors more selective. When cash and short-term bonds offer attractive returns, capital does not automatically flow into high-beta assets. Bitcoin therefore needs either clear momentum, stronger ETF flows, rising inflation-hedge demand, or weaker confidence in fiat liquidity conditions.
At the moment, Bitcoin has enough support to rise, but not enough to ignore macro shocks.
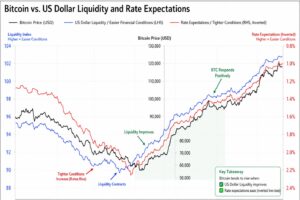
[Chart 2: Bitcoin versus US dollar liquidity/rate expectations, showing BTC’s sensitivity to easier or tighter macro conditions]
The Halving Effect Is Still Working in the Background
The 2024 halving reduced new Bitcoin issuance, and that supply change remains important. The halving does not produce instant rallies on command. Its effect works slowly through the market by reducing new supply while demand fluctuates.
This cycle is especially important because the reduced issuance is now interacting with ETF demand. In older cycles, miners were one of the main sources of regular new supply. After the halving, the daily new issuance is smaller, which means strong spot demand can absorb supply more easily.
That is the structural bullish argument for Bitcoin:
Lower issuance.
Institutional demand through ETFs.
Long-term holders still controlling large supply.
Corporate treasury demand absorbing part of the float.
Reduced exchange balances compared with previous cycles.
The risk is that miners and leveraged holders may sell into strength. Mining margins have been pressured by higher costs and lower block rewards, so some miners may use rallies to raise cash. That can cap upside during the early phase of a recovery.
Still, miner selling alone is unlikely to break the market if ETF and spot demand remain strong.
Derivatives Show the Rally Is Not Yet Overcrowded
The derivatives market gives a mixed but useful message. Bitcoin’s rebound has forced short sellers to cover, which helped accelerate the move above $80,000. Short liquidations can create sharp rallies because bearish traders are forced to buy back exposure.
That is positive in the short term, but it is not enough by itself. Liquidation rallies often fade if spot demand does not follow.
The more constructive detail is that funding has not shown extreme bullish overheating. When funding rates stay moderate or even negative while price rises, it suggests traders are not aggressively crowded on the long side. That can leave room for further upside because the market has not yet reached a euphoric leverage phase.
In simple terms, this rally does not yet look over-owned.
That is good for bulls. But it also means confirmation must come from spot buying, not just forced short covering.
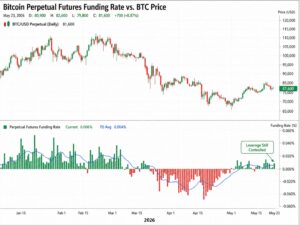
[Chart 3: Bitcoin perpetual futures funding rate versus BTC price, showing whether leverage is overheated or balanced]
Technical Analysis: The $85,000 Zone Is the Real Test
Technically, Bitcoin is trying to confirm a breakout from a multi-week base. The first positive sign is the reclaim of $80,000. The second would be a sustained close above $82,000–$83,000. The third and most important would be a breakout above $85,000.
The chart now has 4 key zones:
| Price Zone | Meaning |
|---|---|
| $90,000 | Major bullish continuation target |
| $85,000 | Main resistance and breakout confirmation level |
| $82,000–$83,000 | Immediate decision zone |
| $80,000 | Psychological support |
| $76,000–$78,000 | Pullback support |
| $72,000 | Structural support; losing it weakens the bullish case |
The $85,000 level matters because it is where sellers may return. Traders who bought lower may take profit there. Traders trapped from previous highs may use the level to exit. Short sellers may also defend the zone.
If Bitcoin breaks through $85,000 with strong volume, the next move could be fast because many traders are watching the same level.
If Bitcoin fails there, the most likely outcome is a pullback toward $80,000 or $78,000.
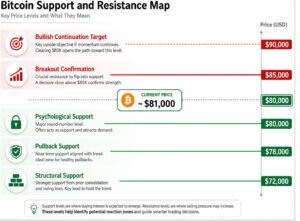
[Chart 4: Bitcoin support and resistance map showing $72,000, $78,000, $80,000, $85,000 and $90,000]
Momentum Is Improving but Not Stretched
Momentum indicators would likely show improvement after the reclaim of $80,000. The important point is that Bitcoin has not yet entered a vertical move. That makes the setup healthier than a panic-driven breakout.
A strong trend usually needs several stages:
First, price stops making lower lows.
Second, price reclaims the short-term moving averages.
Third, buyers defend the first pullback.
Fourth, price breaks the main resistance zone.
Fifth, old resistance becomes support.
Bitcoin appears to be between stages 3 and 4. It has recovered, but it still needs to prove that the move can survive resistance near $85,000.
The ideal bullish pattern would be:
BTC closes above $82,000.
Price pulls back but holds $80,000.
Buyers step in quickly.
BTC breaks $85,000.
The market retests $85,000 as support.
Momentum expands toward $90,000.
The bearish pattern would be:
BTC fails below $85,000.
Price loses $80,000.
The rebound fades into $76,000–$78,000.
A weak bounce follows.
BTC breaks below $72,000.
That second structure would suggest the rally was driven by short covering rather than real accumulation.
Volume Confirmation Is Essential
Price alone is not enough. Bitcoin needs volume confirmation. A breakout above $85,000 on weak volume would be less convincing because it could be reversed quickly. A breakout on rising volume would show stronger acceptance.
The same applies to pullbacks. If BTC pulls back toward $80,000 on declining volume, that is usually healthy. It shows sellers are not pressing hard. If the pullback comes with heavy volume and wide candles, the market is telling a different story.
The best technical setup would be a controlled consolidation above $80,000 followed by a high-volume breakout above $85,000.
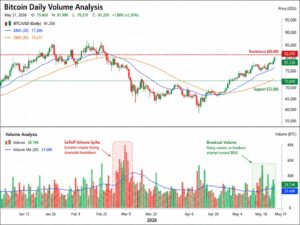
[Chart 5: Bitcoin daily volume chart comparing breakout volume against prior selloff volume]
Bullish Scenario
The bullish case is straightforward. Bitcoin holds above $80,000, ETF inflows remain positive, leverage stays controlled, and macro risk does not worsen. In that case, BTC can push toward $85,000 first and then $90,000.
A clean break above $90,000 would change the market psychology. Traders would stop treating the move as a rebound and start treating it as a trend resumption. That could bring sidelined capital back into the market, especially from systematic traders and momentum funds.
In this scenario, Bitcoin could begin moving toward the previous high zone, although it would likely face volatility along the way.
Bullish confirmation levels:
$82,000–$83,000: short-term strength.
$85,000: breakout confirmation.
$90,000: momentum expansion.
Above $90,000: trend-following demand likely increases.
Bearish Scenario
The bearish case begins with failure near $85,000. If Bitcoin cannot clear that zone, short-term buyers may take profit, and late longs may exit. That could drag BTC back toward $80,000.
A break below $80,000 would not immediately kill the recovery, but it would weaken momentum. The bigger danger comes if BTC then loses $76,000–$78,000. That would put the market back into a wider range and make the recent breakout look false.
Below $72,000, the structure becomes clearly weaker. That would suggest the market rejected higher prices and that ETF demand was not strong enough to absorb overhead supply.
Bearish confirmation levels:
Below $80,000: momentum weakens.
Below $78,000: breakout failure risk rises.
Below $72,000: bullish structure breaks.
Base Case
The base case is consolidation before continuation. Bitcoin has improved enough to avoid a deeply bearish reading, but it still needs confirmation above $85,000.
The most likely near-term path is a choppy range between $78,000 and $85,000 while traders wait for clearer signals from ETF flows, macro data, and volume. A break from that range will probably define the next major move.
Above $85,000, the advantage shifts clearly to bulls.
Below $78,000, caution rises.
Below $72,000, the recovery thesis weakens sharply.
Final View
Bitcoin’s setup is constructive but unfinished. The fundamental backdrop has improved because ETF demand is returning, post-halving supply remains tight, and derivatives positioning is not extremely crowded. The technical picture also looks better after the reclaim of $80,000.
But the chart still needs confirmation.
The decisive level is $85,000. A strong close above it would open the door to $90,000 and potentially shift Bitcoin into a broader bullish continuation phase. Failure there would likely send BTC back toward $80,000 or $78,000.
For now, Bitcoin is in a recovery phase, not a confirmed breakout phase. Bulls have control above $80,000, but they need $85,000 to turn the move into something bigger.