
On October 20, customers of Revolut, HSBC and Lloyds encountered banking disruptions while Google’s London cloud region was failing. What first appeared to be a routine infrastructure outage became a revealing systems test: one facility lost power, its automatic generator handover failed, and the attempt to shift workloads into healthy infrastructure spread elevated errors across a larger cloud region. Google’s subsequent incident report explains the mechanism far more precisely than the initial bank-app outage notices. It does not, however, reveal the internal software architecture of every affected bank. That distinction is the starting point for understanding why several institutions could become unavailable at once. [1][2][3]
The evidence: a regional incident, not proof of identical bank failures
Google’s final published incident account places the initiating electrical disruption at 06:53 British Summer Time on Tuesday, October 20, 2026, in the facility hosting zone `europe-west2-b`. The critical loss of service began about seven minutes later, at 07:00 BST, when batteries were exhausted and affected infrastructure lost power. Google defines its principal disruption window as 07:00–13:08 BST, or six hours and eight minutes. Earlier contemporaneous reports used slightly different incident-start timestamps. For root-cause analysis, the later engineering report is the superior source. [1]
Revolut publicly reported disruptions to multiple services, including login, card transactions and access to cash, while assuring users that their data and money remained safe. Lloyds and HSBC also acknowledged customer-access problems during the period. Reuters and AP reported the overlap and the Google incident. This supports describing a shared external event affecting the financial-services ecosystem; it does not establish that all three banks placed the same production databases, authorization systems, or identity services in the affected Google zone. No such complete bank-by-bank topology has been published in the sources examined. [2][3][4]
ANALYTICAL TABLE
| What is confirmed | What is not publicly established |
| Google: London zone power loss, failed generator switchover | Exact provider arrangements at each named bank |
| Revolut: multiple customer-facing services impaired | Which individual Revolut components ran in the zone |
| HSBC and Lloyds: reported customer-access disruptions | Whether every symptom had precisely the same proximate cause |
| Provider: regional failover queues and storage recovery | Complete bank-level failed-payment counts and RTOs |
The distinction is operationally important. One firm may have run a customer-facing app directly in the London region, another may have depended on a downstream provider hosted there, and a third may have experienced a concurrent but technically separate failure. The public record does not let us assign these architectures to individual banks with confidence. Ascribing the same cause to every reported failure would go beyond the available evidence. The confirmed causal chain is at the Google platform layer; the precise path into each bank’s application remains partly private.
A seven-minute chain that defeated redundant power
The London site’s power design had duplicated utility paths and a central high-voltage generator bank operated through redundant programmable logic controllers. At 06:53 BST an external electrical supply event occurred. Automatic generator startup and transfer did not complete because of a PLC startup fault. Uninterruptible power supplies maintained load for a short period, but the batteries were depleted by 07:00 BST. Physical hosts, network-aggregation equipment and storage in the affected zone then dropped offline. [1]
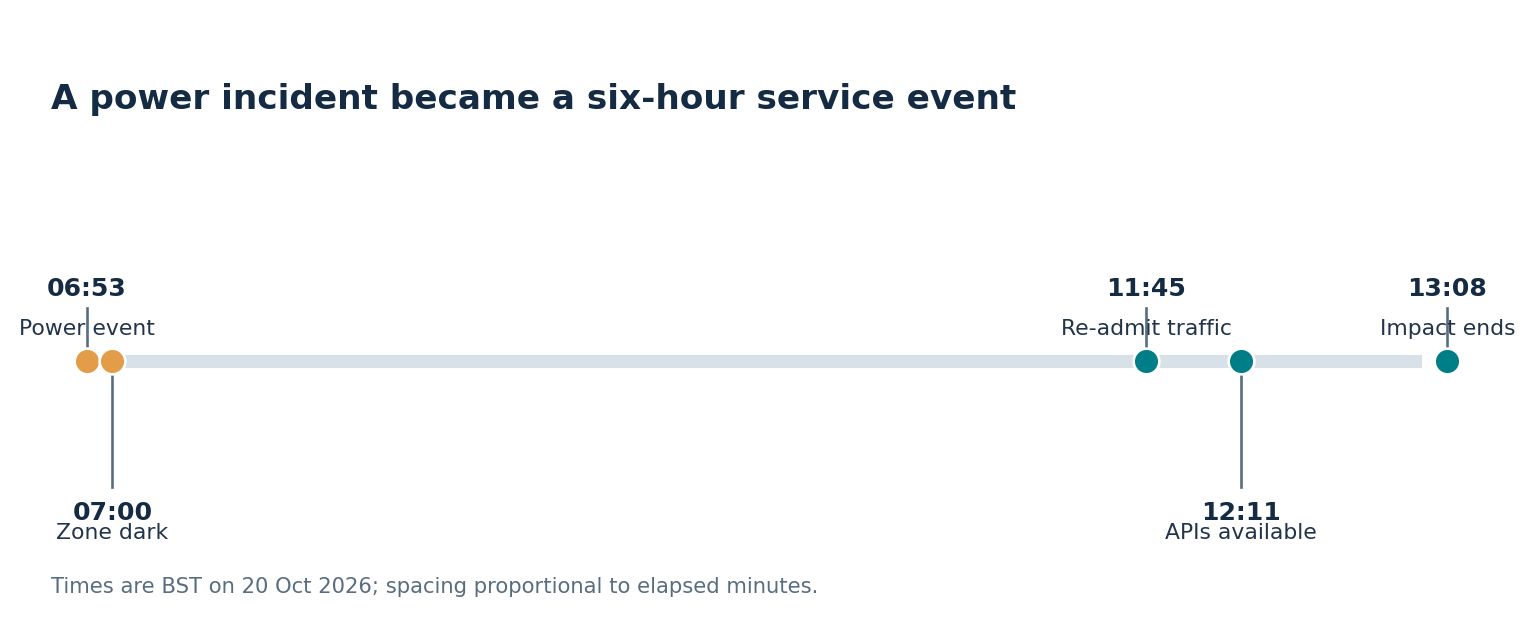
Figure 1. Google’s incident milestones in British Summer Time; initiating event precedes impact start.
The incident is a useful caution against counting backup components and concluding the entire system is independent. Two utility feeds protect against some single failures; two PLCs can still share logic, configuration, control wiring, environmental assumptions or a mode that prevents the generator sequence from starting. Google’s report identifies the PLC-startup fault but does not disclose every specific shared failure mode. The fair lesson is narrower: installed hardware redundancy did not prevent a common operational failure in the switchover path.
Google’s control systems detected the problem within minutes, but detection was not restoration. Replacing a failed zone’s capacity and safely recovering disks are harder tasks than identifying which alarm tripped. The provider reported unclean storage shutdowns, which forced additional recovery before services could be fully re-admitted. At 11:45 BST engineers began controlled traffic re-admission to the affected zone. Platform services and APIs were fully available by 12:11 BST, while lingering compute workloads needed longer, with overall incident impact ending around 13:08 BST. Those milestones explain why the status of a provider, its APIs and an end-user app can disagree for a time. [1]
The second failure happened in healthy infrastructure
Google documented more than a dead data-center zone. Regional traffic routing and clients attempted to move work to unaffected zones or regions, while control-plane requests to metadata and catalog components in the lost zone timed out. Incoming queries, database failovers and job replays then competed for spare capacity elsewhere. This produced queuing, increased latency and intermittent HTTP 500 and 503 responses across a broader part of `europe-west2`. A protective failover mechanism became an amplifier of congestion. [1]
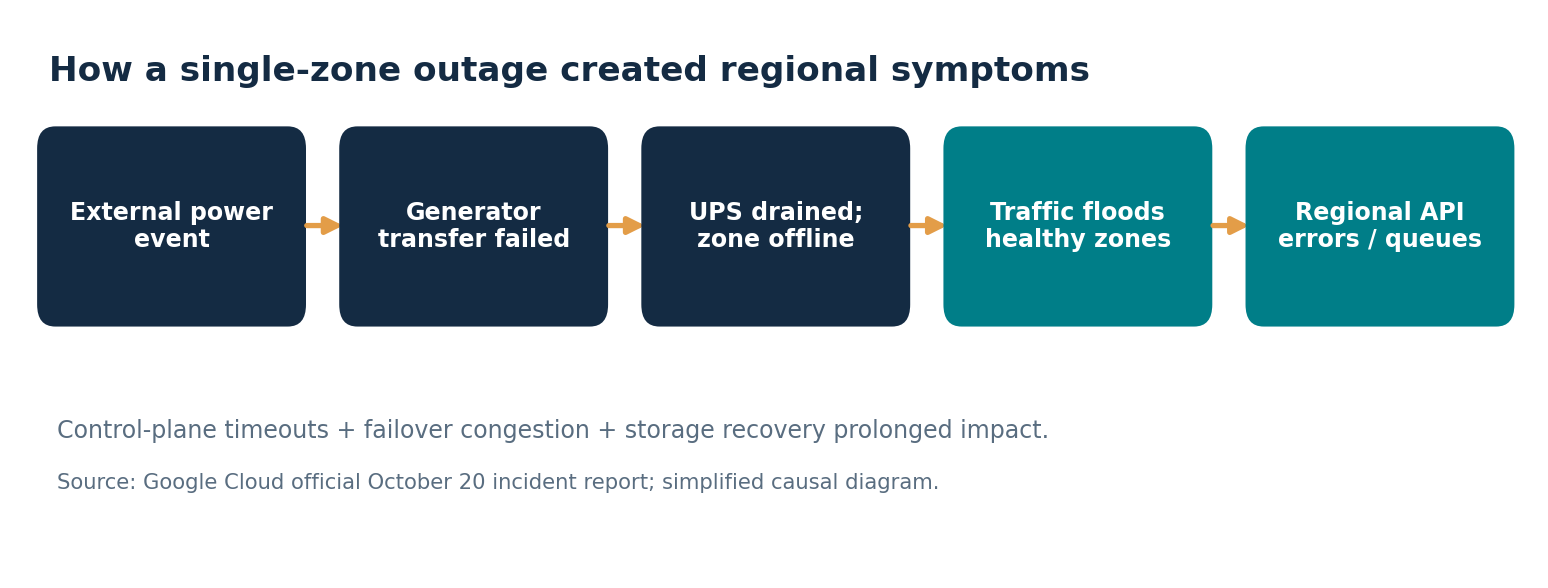
Figure 2. Simplified incident mechanism: electrical failure, failover congestion and regional errors.
That does not imply that automated failover is a mistake. It means recovery plans must reserve enough capacity for failures and must avoid directing successful services to broken dependencies. A replacement availability zone with no spare compute capacity is only a new address for the same overload. A healthy application server that cannot obtain identity tokens or reach a regional database control plane may still return an error to the customer. For a bank, the outward symptom could be a failed sign-in even when the deposit ledger itself remains intact.
The failure sequence also challenges the idea that a cloud ‘region’ is always one monolithic site. Google organizes regions into multiple zones with separate physical infrastructure, and services differ in whether they are zonal, regional or multi-regional. Google Cloud’s own resilience guide advises critical financial applications to use at least two regions and three zones per region. Yet logical isolation alone cannot guarantee survival if dependencies, quotas, database recovery and over-capacity traffic are coupled. [1][5][6]
It is a small detail, but it changes the math: failover is not merely moving a replica. The application has to finish the work, too. Existing attempts, timeouts and re-tries compete with new requests until queues and state have been reconciled.
An original capacity model explains the cascade
Consider a simplified active-active service spread evenly across three identical availability zones. Let its total normal utilization be 55%, 65%, 70% or 80% of the region’s combined theoretical capacity. If one zone disappears instantly, two-thirds of capacity remains. Assuming all demand is retained, surviving infrastructure must absorb 1.5 times its previous regional utilization: a 70%-loaded region now needs 105% of the two surviving zones’ nominal capacity. That is overloaded even before considering replay traffic, retries or failover overhead. This is arithmetic, not Google’s measured production utilization or any bank’s actual architecture.
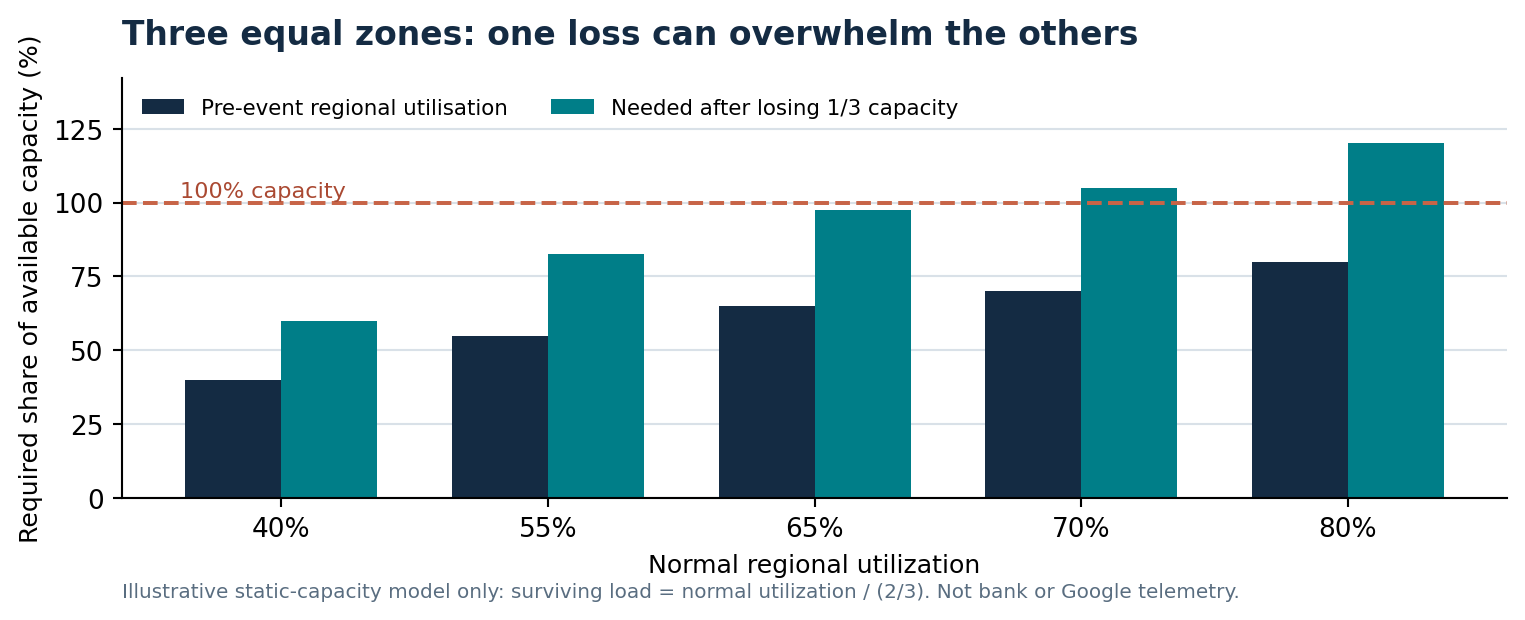
Figure 3. Original theoretical headroom model for a one-zone failure in a three-zone region.
ANALYTICAL TABLE
| Normal regional load | Capacity remaining | Survivor load requirement | Illustrative status |
| 55% | 66.7% | 82.5% | Headroom |
| 65% | 66.7% | 97.5% | Little headroom |
| 70% | 66.7% | 105.0% | Over nominal capacity |
| 80% | 66.7% | 120.0% | Likely queuing without relief |
At a preincident 55% loading, the two surviving zones would carry about 82.5% utilization and may have headroom, subject to uneven service placement. At 80%, they would need 120% capacity; some requests must queue, fail or be diverted to another region. A managed service that scales dynamically may improve this picture, but bootstrapping capacity, database reconstruction and regional quota enforcement still impose time and state constraints. Some applications can absorb a zone loss gracefully at high load; others cannot tolerate a single missing control-plane dependency at any load.
This arithmetic is useful for evaluating bank statements after an incident. A bank may announce that its systems are distributed ‘across three zones’. That reveals physical diversification but not spare capacity, replication topology or readiness to absorb a full-zone failure. More than one copy is necessary; it is not a complete recovery plan. Google’s published financial-services reliability guidance recommends multi-region design, but meeting that recommendation requires end-to-end engineering rather than a dashboard setting. [5]
A card can fail while the customer’s balance is still safe
During the incident, public Revolut communications covered card payments, withdrawals, transfers and account access. Those operations are not one system. A card payment depends on a chain of device or merchant, payment network, issuer authorization, fraud screening and balance or credit decisions. Cash withdrawal may involve an ATM operator and network, then the issuing bank. Sign-in involves identity and session infrastructure. A bank can keep a durable ledger while front-end authorization or orchestration components cannot process requests. [2][3]
This is why a bank saying that funds were safe is neither evidence of normal service nor an admission that money vanished. Availability and asset custody are separate dimensions. Customers can be unable to spend accessible-looking funds without a loss of ownership; conversely a fully functional app is not proof of adequate customer asset safeguards. Dave Finances’ report on a Japanese bank API outage affecting multiple downstream companies illustrates the same separation between upstream financial infrastructure, downstream functionality and balances.
For consumers there are still measurable consequences: declined purchases, missed payments, inability to obtain cash, duplicated attempts and uncertainty over whether an instruction was accepted. A sensible recovery design must make retries idempotent, reconcile queued transactions against the ledger and give users a clear outcome rather than asking them to guess whether an ATM request or transfer was recorded. The financial loss need not involve stolen funds. A service that fails when a train ticket must be bought has already imposed a cost.
We should also resist assuming that customer-impact duration equaled six hours and eight minutes at each bank. Google’s reported duration is a platform incident window; application recovery could have started earlier, finished later or affected only a subset of functions. Without the relevant banks’ internal incident timelines and transaction counts, estimating their actual failed payment volume would be speculative.
Six hours can consume a year’s reliability allowance
The Google incident lasted 368 minutes. For a continuously operating 365-day service, a 99.99% annual availability target allows about 52.6 minutes of unavailability; 99.95% permits about 263 minutes; and 99.9% about 526 minutes. If a hypothetical customer-facing service were wholly unavailable for precisely the full 368 minutes, the incident alone would consume approximately seven times the annual 99.99% downtime allowance, or about 70% of the 99.9% annual allowance. This is a sensitivity illustration, not an assertion that the banks breached a particular contractual service-level objective. [1][7]
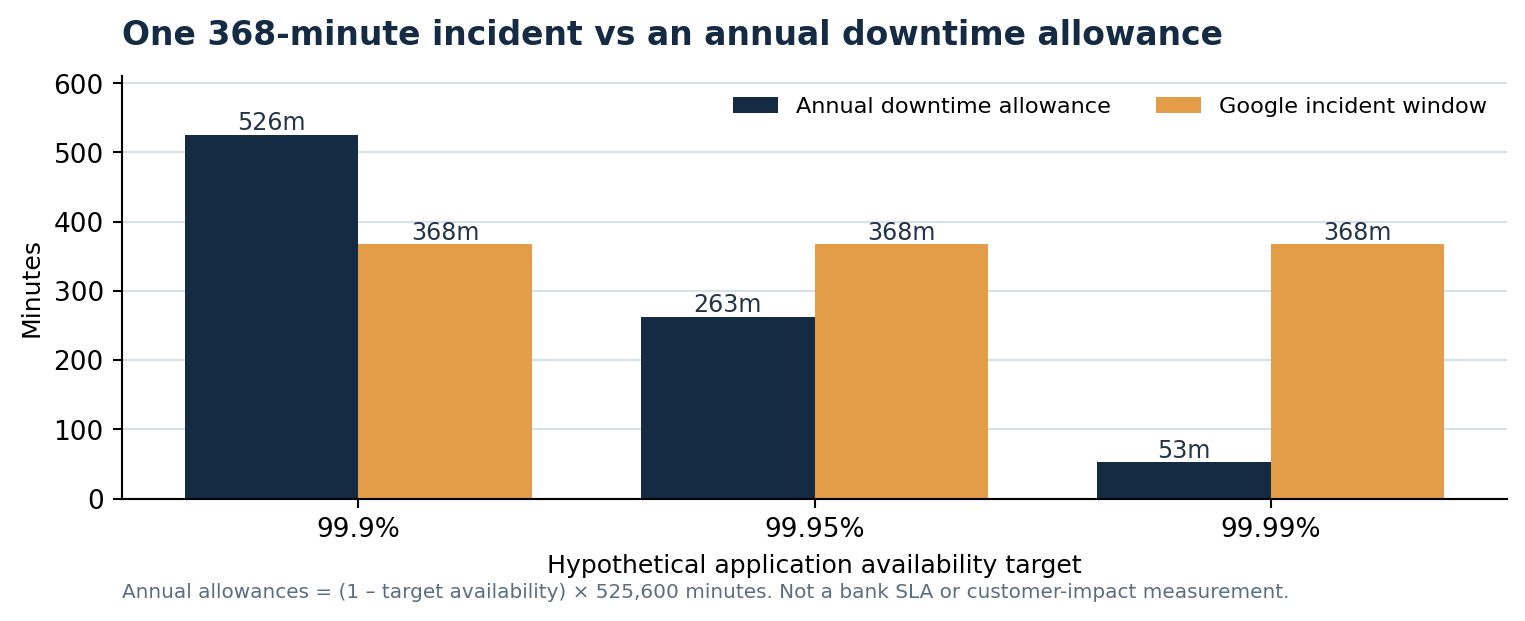
Figure 4. Illustrative service-level downtime allowances compared with the cloud incident window.
ANALYTICAL TABLE
| Annual target | Allowed downtime / year | Google platform window | Allowance consumed |
| 99.90% | 525.6 minutes | 368 minutes | 70% |
| 99.95% | 262.8 minutes | 368 minutes | 140% |
| 99.99% | 52.6 minutes | 368 minutes | 700% |
Reliability metrics also have an exposure problem. A retail bank may remain technically available to 90% of users yet be unavailable to customers of one geography or payment method. A single percentage hides which important business service failed, for how long, how severely and for whom. In practice, a regulator’s ‘impact tolerance’ asks a different question from a cloud vendor’s uptime promise: how much disruption of a material financial service can customers withstand before harm becomes unacceptable? [8][9]
One more illustrative calculation helps separate frequency from severity. If an application experiences 150,000 payment attempts per day at a uniform rate, the 368-minute interval corresponds to about 38,333 scheduled attempts. But only a fraction might traverse the affected dependency; many could be routed through alternatives or retried later. These numbers are deliberately an opportunity-volume estimate, not an estimate of failed Revolut, HSBC or Lloyds transactions. Any monetary ‘outage cost’ requires measured transaction success and cancellation data that the banks have not published for this event.
The regulatory response does not outsource accountability
The UK’s regulators began overseeing the first four designated critical third-party technology providers on July 13, 2026: AWS, Google Cloud, Microsoft and Oracle. Google’s incident therefore occurred roughly three months after that oversight began. Under the framework, the Bank of England, Prudential Regulation Authority and FCA can engage directly with systemically important service providers; Reuters reported questions from British and European authorities following the outage. The designation does not mean every individual cloud product is newly insured, government guaranteed or immune to failure. [3][8]
EU financial entities have also been subject to the Digital Operational Resilience Act since January 17, 2025. DORA addresses ICT risk, incident reporting, testing, third-party dependencies and oversight of designated critical providers. Europe’s supervisors designated 19 critical ICT third parties in late 2025, including Google Cloud. But direct oversight of a cloud provider does not cancel a bank’s duty to map its important functions or ensure continuity. The Bank of England’s published guidance explicitly states that institutions remain accountable for obligations even when they outsource. [9][10][11]
This is not a mere legal technicality. A financial firm cannot answer a regulator’s resilience question simply by showing the cloud provider’s uptime chart. It needs to explain which service depends on which cloud function, the consequence if an entire zone disappears, its tested migration route, alternatives for critical payments and user communications, and where transaction state is reconciled after recovery. Dave Finances has covered other payment disruptions that propagate across infrastructure layers. The repeating structural risk is dependency concentration.
Is the answer to use a second cloud provider?
Not automatically. Spreading workloads across AWS, Azure and Google can reduce exposure to a single vendor, but adds cost, consistency challenges, security complexity and duplicated operations. Two providers can still rely on the same network, identity administrator, payment switch, DNS service, key-management process or vendor library. A multi-cloud slide is not a substitute for a tested payments recovery architecture. Conversely, two independent Google regions with adequate capacity and verified state transfer may be better than a superficially multi-cloud design with one shared database.
For high-criticality services, the design choice should start with the actual business-service objective. A fallback payments channel may require a second issuer processor rather than a second application-hosting vendor. Logging in may depend on a separately resilient identity service. A read-only balance service can be recovered differently from a write path handling authorization and settlement. These differences argue for component-level testing and explicit failure-mode mapping. Google itself frames disaster recovery in terms of recovery time objective (RTO) and recovery point objective (RPO), warning about the distinction between backup availability and application recovery. [6]
The hidden price of resilience is operational overhead. Active-active duplication adds fixed capacity, data replication, operational exercises and sometimes cross-region traffic charges. But a cheap standby system that cannot be activated within the bank’s impact tolerance is a cosmetic saving. A principled investment decision compares the annualized incremental cost of tested redundancy with plausible customer harm, remediation cost, regulatory exposure and lost payment volume. The probabilities are difficult to estimate; the incident shows that a common-zone failure belongs in the scenarios rather than being discarded as too remote.
The case against indiscriminate redundancy is just as strong. If a noncritical marketing page can be down for a few hours without material harm, making it globally active-active may waste resources that should be allocated to card authorization and cash withdrawal. Resilience should be tiered by consequence. Dave Finances’ reporting on Paysafe’s extended payment API disruption provides a different illustration of how an upstream restoration can lag the customer transaction lifecycle.
What banks and customers should watch next
Three technical answers would materially improve the public record. First, did the affected banks rely directly on the failed London zone, on regional managed services, or on vendors farther down their supply chains? Second, what fraction of each critical service remained operational, and how long did reconciliation and deferred processing take after Google marked its platform recovered? Third, did the banks already have recovery routes that failed during activation, or were their systems designed to wait for the cloud region to return? Those are questions, not claims that any named institution was negligent.
For a consumer, the practical response to a lengthy outage is modest but valuable: avoid repeated high-value transfers without checking confirmation, save transaction references, confirm direct-debit or card attempts after restoration, and keep an independently functioning second payment method where feasible. Keeping a second card from the same app or issuer may not diversify the relevant dependency. During an interruption, official status pages matter more than social-media reports of failure counts.
For investors, the information to seek is enterprise and bank-level service reliability by function, concentration in a small set of critical providers, reportable impact tolerance breaches, resilience capital expenditure and evidence of recovery exercises. ‘Cloud migration completed’ is not a risk metric. An insurer, payments processor or bank with thousands of redundant hosts but one payment authorization choke point can still have an unacceptable single-point failure.
Bottom line
The October 20 event began as an electrical outage in one Google Cloud zone. A failed generator-transfer path, storage recovery and failover pressure turned it into a roughly six-hour regional cloud disruption, coinciding with customer-facing difficulties at multiple banks. Google’s postmortem explains the cloud-side propagation, but it does not prove the complete technical dependency of each bank. The greater lesson is about shared failure domains: redundancy that cannot absorb diverted demand can spread an outage, while a successful infrastructure restart does not itself reconcile customer transactions. Banks should be judged on the survival of essential financial services, not the number of backup components on an architecture diagram.
Methodology and limitations
The event timeline follows the detailed incident report on Google’s official service-health site, using BST consistently and distinguishing the 06:53 initiating event from the 07:00 start of measured service impact. Other contemporary timestamps are not treated as superior to the later engineering report. The regional capacity illustration assumes three equal zones, uniform placement and constant demand, with survivor utilization equal to normal regional utilization divided by two-thirds. It excludes auto-scaling, spare cross-region capacity, uneven dependencies and retry effects. The uptime comparison assumes 365 days, or 8,760 hours, and compares Google’s infrastructure impact window with purely hypothetical end-to-end outages. No named bank’s service-specific SLA, successful transaction count, cloud contract or private architecture was available for verification. The legal discussion cites official UK, EU and cloud guidance; it does not assign a regulatory breach to any firm. This is a technical and financial analysis, not a forensic audit.
Sources and verification
Numbered evidence references used in the text. Original documents are linked below; accessed on November 12, 2026.
[1] Google Cloud Service Health: Oct. 20 London incident report
[2] Reuters: Oct. 20 disruption affecting banks and services
[3] Reuters: EU and UK regulators query Google, Oct. 21
[4] Associated Press: Google Cloud outage hits UK banks, Oct. 20
[5] Google Cloud: Financial services reliability architecture
[6] Google Cloud: Architecting disaster recovery for cloud infrastructure
[7] Google Cloud: Service health, regional monitoring
[8] Financial Conduct Authority: UK critical third-party oversight starts
[9] Bank of England/PRA: Operational-resilience expectations for banks
[10] European Banking Authority: Digital Operational Resilience Act
[11] European Banking Authority: DORA register implementation
[12] Financial Conduct Authority: Critical third parties—practical regime
[13] ITV News: Revolut and other UK banking outages, Oct. 20
[14] Google Security Products: SecOps incident Oct. 20

Johan Shamshad is Editor-in-Chief at Dave Finances, covering financial markets, digital assets, trading platforms, brokers, fintech, payments and regulation. Since 2023, he has also worked as an editor at Gulf News, the UAE English-language newspaper published by Al Nisr Publishing LLC. His work focuses on market-moving developments, company disclosures, regulatory changes and trading infrastructure, with an emphasis on primary-source verification and practical context for traders and investors.