The October decision was not an endorsement of steady rates for the rest of the year. It was a delay while officials assessed how sticky inflation, resilient demand and an unusually large AI investment cycle interact.
The Federal Reserve’s October pause concealed a narrow difference in timing rather than a wide disagreement about inflation. Minutes published November 18 show that almost all meeting participants thought further increases in the federal funds target range would likely be appropriate under their baseline outlooks. The committee kept the rate at 3.75%–4.00% by a 10–2 vote, with Governor Lisa Cook and Cleveland Fed President Beth Hammack favoring an immediate 25-basis-point increase. The next scheduled decision is December 9.
That distinction is more useful to investors than calling the decision hawkish or dovish. The September rate increase had already lifted the policy range by 25 basis points, and most officials wanted time to observe its effect. But the October minutes include a still-firmer contingency: a couple of participants said an increase larger than 25 basis points could warrant consideration if forthcoming inflation data were unfavorable. The document describes a conditional view, not a commitment or a vote for a 50-basis-point move.
The other surprise lies outside conventional inflation analysis. Policymakers discussed AI investment as an immediate source of demand and cost pressure, while also worrying that disappointing AI returns could push down asset prices and expose less-visible debt structures. For a retail portfolio loaded with technology stocks, long-duration bonds or floating-rate borrowing, those can be different losses arriving from the same economic theme.
The September Dot Plot Still Points to Another Hike
The September Summary of Economic Projections provides a numerical anchor for interpreting the minutes. Its median expected appropriate policy rate for year-end 2026 was 4.1%, compared with the current target-range midpoint of 3.875%. Because the Fed reports projected rates rounded to one decimal place, a conventional 25-basis-point increase to a 4.00%–4.25% range would have a 4.125% midpoint, displayed as 4.1%. This is an implied path based on the September median, not a prediction about the December vote. [3]
The same September median put 2027 at 4.1%, 2028 at 3.9% and 2029 at 3.6%. Taken literally, that is a longer plateau after a possible further hike rather than an immediate easing cycle. But a median cannot show how strongly individual policymakers hold their estimates, and the September projections preceded subsequent employment and inflation data. The October minutes therefore add directional information, not a new dot plot.
The voting count also does not measure the entire committee’s preferred future path. Twelve committee members voted on the October action, while 18 participants submitted September economic projections. Nonvoting regional Fed presidents can participate in discussion. Treating the 10–2 vote as evidence that ten officials oppose future hikes would be a category error. They accepted a pause at that meeting; several wanted a firmer signal about what came next. [1][3]
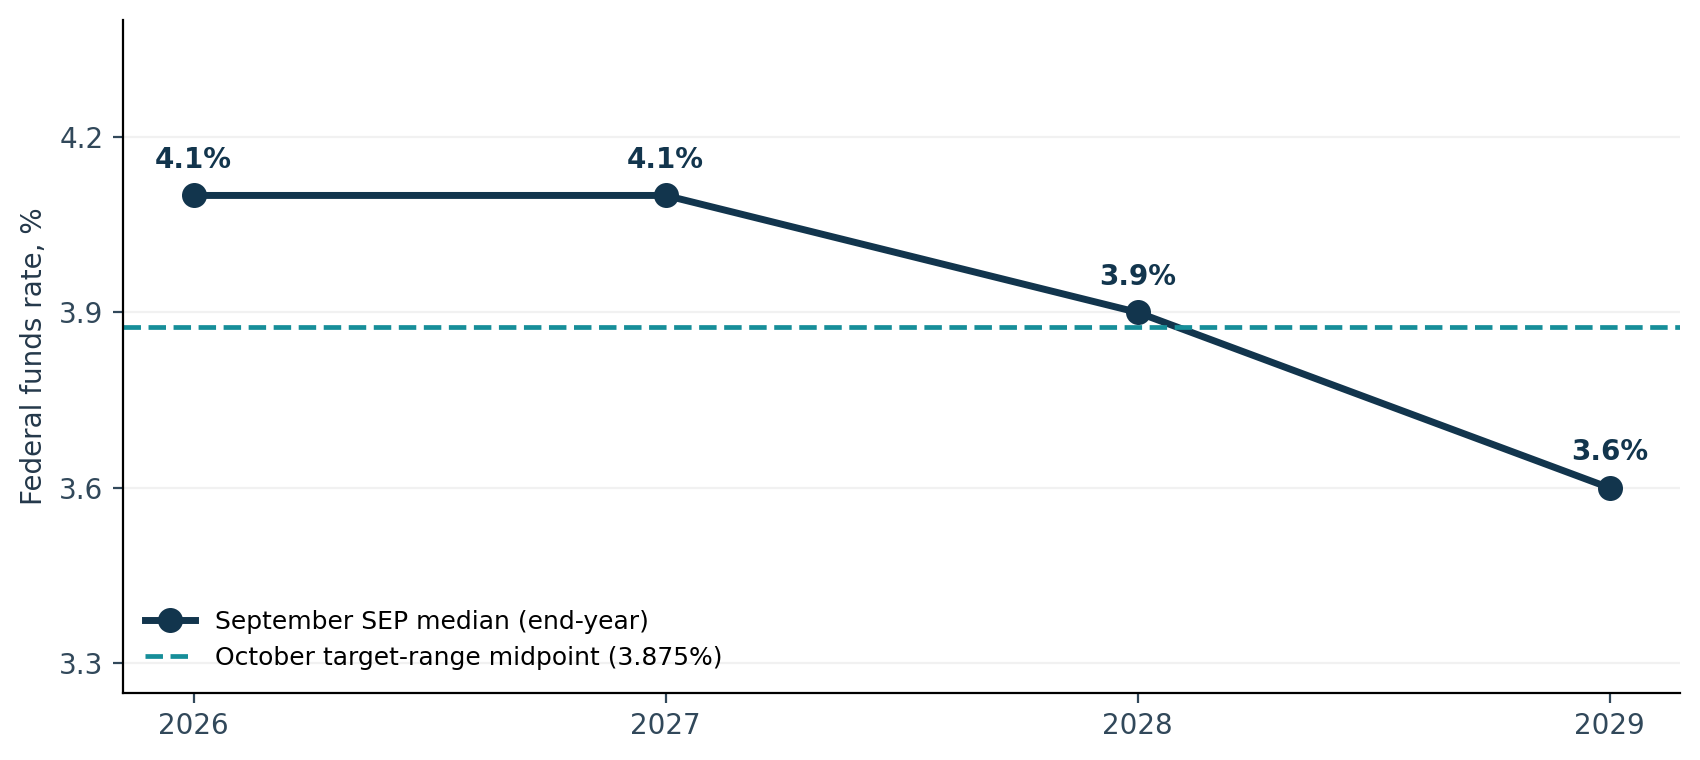
Figure 1. September 2026 SEP median end-year rates versus the October policy midpoint. The SEP is a compilation of participants’ assessments, not a committee promise or market-implied forecast. Source: Federal Reserve September SEP and October statement; Dave Finances calculation.
This matters because a pricing market cares about the change in the expected path, not just the overnight target today. A December quarter-point increase would move the upper end of the range to 4.25%. If investors had already incorporated that change, its effect on Treasury yields or the dollar might be modest. A larger-than-expected move, or guidance that holds rates elevated through 2027, can have a broader impact. The October rate hold’s effect on Bitcoin, gold and technology stocks was already an open question before the minutes supplied more evidence.
Inflation Momentum Is Harder to Read Than the Headlines
The data available by November 18 support caution without resolving the policy decision. September’s personal consumption expenditures price index, the Fed’s preferred inflation measure, rose 3.6% over 12 months; core PCE, which excludes food and energy, rose 3.1%. Both were above the 2% goal. October’s consumer price index rose 0.4% month on month, and core CPI increased 0.3% for the third consecutive month. PCE and CPI are different indexes and cannot be swapped into the same time series. [4][5]
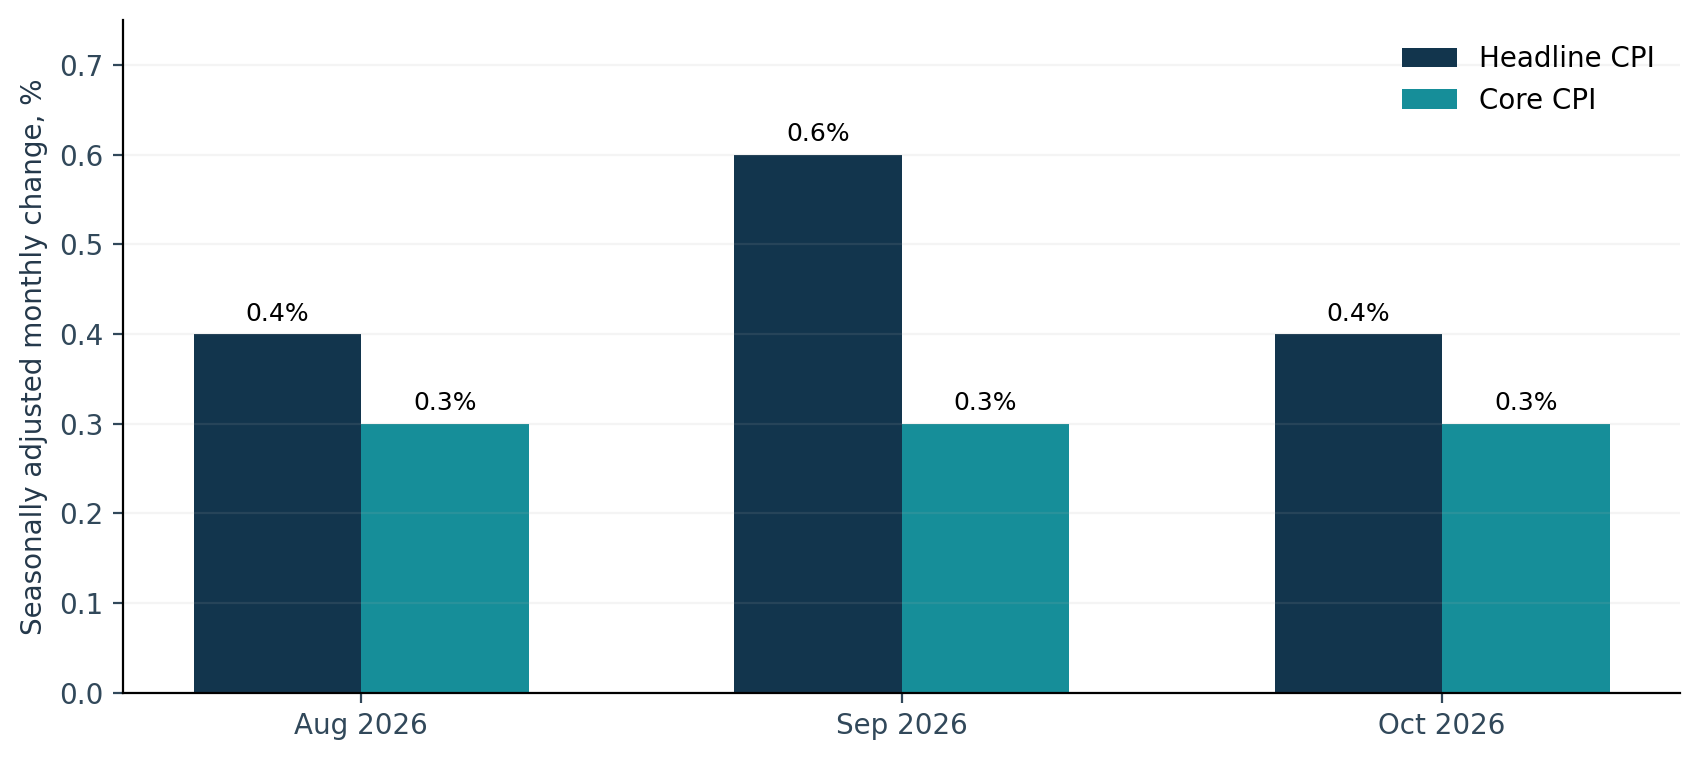
Figure 2. Monthly CPI readings are not the same as 12-month PCE inflation. October 2026 year-over-year CPI comparisons were unavailable for most components because October 2025 collection was interrupted. Source: BLS October CPI release; Dave Finances visualization.
There is a subtle statistical trap in reporting a 2026 October annual CPI rate. The Bureau of Labor Statistics said it lacked October 2025 observations for most CPI series because of the lapse in appropriations. It consequently did not publish those 12-month comparisons. Replacing them with estimates without disclosure would create an apparent data point the official release does not contain. The observable October signal is the monthly rise, supplemented by the separately reported PCE data. [5]
For intuition, repeating a 0.3% monthly increase for 12 months would produce about 3.66% compounded inflation: (1.003)^12 – 1. That is an arithmetic illustration of pace, not a year-ahead CPI forecast and certainly not an estimate of PCE inflation. It makes the policy challenge clear. A string of seemingly moderate monthly core increases can be inconsistent with an early return to 2% if it persists.
The October employment report offered a reason to avoid overreacting to one price release. Payrolls rose 165,000 and unemployment was 4.1%, broadly unchanged, according to the Bureau of Labor Statistics. The Fed’s September projections also put the unemployment rate at 4.1% for both 2026 and 2027. With neither a sharp labor-market deterioration nor clean price stabilization in the data, officials have a difficult reason to either hurry or stop. [3][6]
Households offer another cautionary indicator. The New York Fed’s October consumer survey placed median expected inflation at 3.9% over one year, 3.3% over three years and 3.0% over five years. These are survey expectations, not the Fed’s PCE target and not market inflation breakevens. They nevertheless show why policymakers worry about the persistance of price pressures even after energy gains moderate. The survey also recorded a higher perceived probability of unemployment rising over the next year. [7]
AI Creates Both an Inflation Channel and a Financial Risk
The October minutes describe a two-sided AI mechanism. In the near term, data-center construction, electricity consumption, servers and other infrastructure compete for labor, equipment and financing. The added demand can raise costs before additional computing capacity boosts productive supply. Some participants also thought rapid AI capital spending might crowd out other investment. Greater productivity could later permit faster real growth with less inflation, but its timing and distribution remain uncertain. [1]
The second side is financial. Fed staff flagged growing AI-related debt, off-balance-sheet leases and circular financing arrangements among firms in the sector. Meeting participants discussed a possible repricing of AI assets if expected returns fail to materialize; they also cited concentrated exposures and incomplete visibility into banks’ indirect links to nonbank lenders. Governor Michael Barr separately discussed this issue in a November 16 speech accompanying the Fed’s Financial Stability Report. The conclusion is not that an AI bust is certain. It is that high investment demand and high financing risk can coexist. [1][8]
| AI channel | Initial economic effect | What could reverse it |
| Construction demand | More spending on equipment, power and labor may raise near-term inflation. | Projects are cancelled, capex is delayed or capacity expands faster than demand. |
| Productivity payoff | Higher output per worker could lower unit costs later. | Gains accrue narrowly, slowly or fail to justify earlier spending. |
| Financing leverage | Debt and lease claims magnify the sensitivity of marginal projects. | Asset repricing prompts tighter terms, margin demands or refinancing stress. |
| Market valuation | Expected long-run AI cash flows support current prices. | Higher discount rates or weaker realized margins reduce present values. |
It is the same investment boom, two macro consequences. Stronger AI spending can make the case for higher policy rates while supporting certain companies’ near-term revenue. Weak returns can hurt equity valuations and tighten credit conditions even as reduced spending eventually relieves demand pressure. For investors, a lower future inflation rate would not mechanically undo an earlier loss in AI equities. AI earnings and the Fed’s discount-rate question has become a connected rather than seperate valuation issue.
A counterargument deserves equal weight. Strong AI investment may produce supply gains sooner than the committee expects, allowing output and productivity to improve without sustained wage pressure. Governor Cook’s September remarks treated the initial demand impulse and later supply response as separable stages. That would weaken the case for keeping nominal rates high simply because data-center investment remains robust. The difficult part is measuring that supply response soon enough to guide the next one or two meetings. [9]
What a 25- or 50-Basis-Point Increase Costs
Interest-rate sensitivity can be estimated without inventing an interest-rate forecast. If a floating-rate balance reprices fully and immediately, a 25-basis-point increase adds 0.25% of the principal to annual interest expense; 50 basis points adds 0.50%. The assumption is deliberately mechanical. Actual credit-card APRs, bank deposit yields and mortgage rates are set by lenders and do not move in lockstep with the federal funds target.
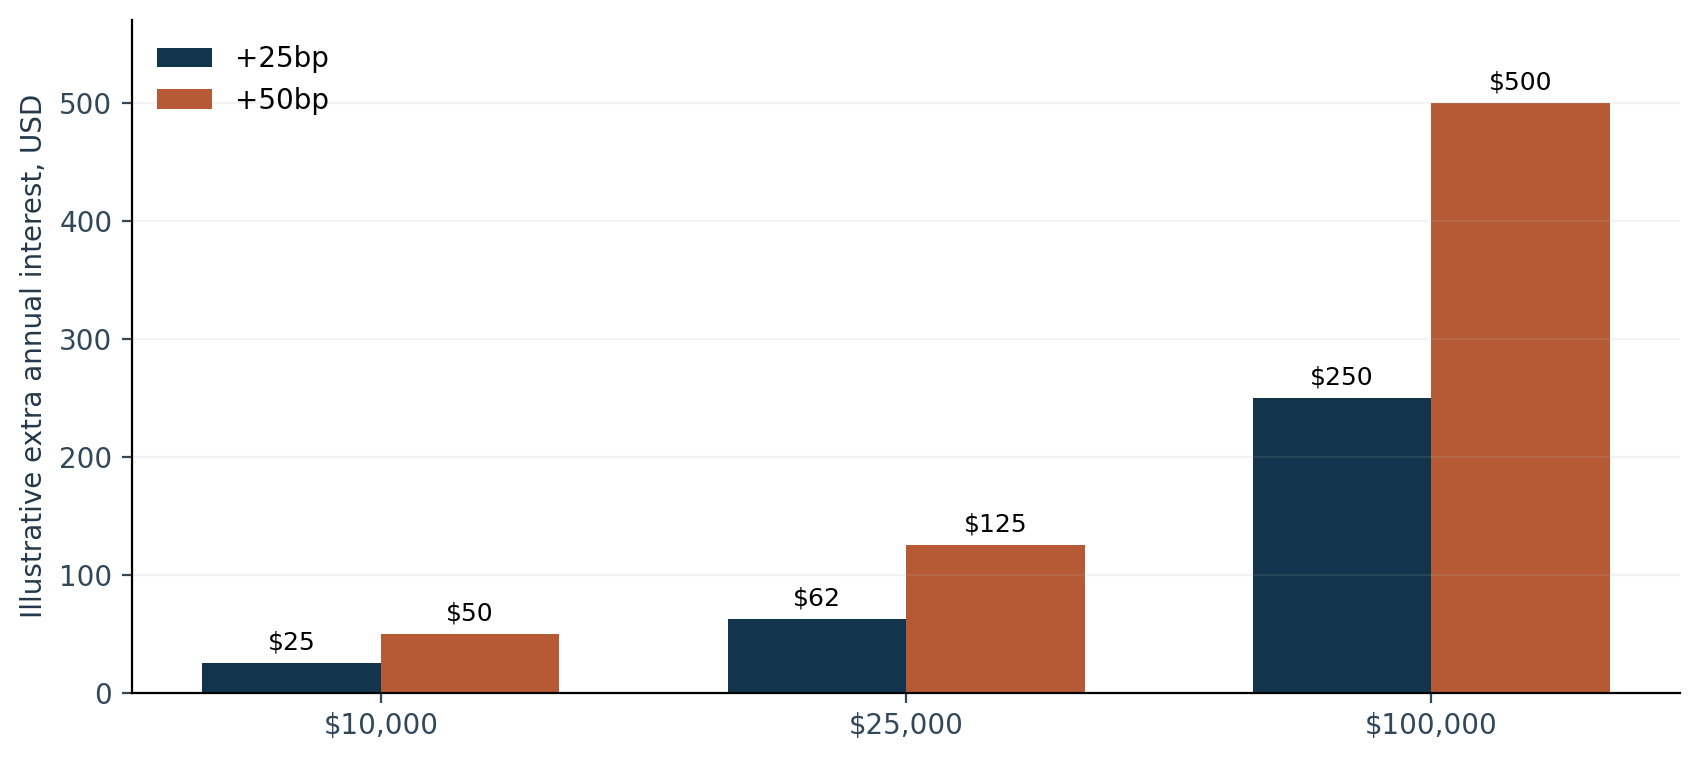
Figure 3. Illustrative annual change in interest cost for fully floating balances with complete, immediate rate transmission and no amortization. The bars are calculations, not lender quotes or forecasts.
On a $10,000 floating-rate balance, those shocks correspond to $25 or $50 of extra annual interest. For a $100,000 variable-rate business loan, they are $250 or $500. The dollar figures look modest for a single step, but they compound with earlier increases and can be economically relevant for thin-margin borrowers. A borrower must also distinguish a 25-basis-point change in the policy rate from a 25-basis-point change in the offered loan spread; the two can diverge when credit risk deteriorates.
The investor side is less linear. A money-market fund can benefit from higher short-term yields, but only after portfolio turnover and expenses; a fixed-rate bond can lose market value as yields rise. For an equity valuation, the direction of earnings and the discount rate both matter. A simplified perpetual $10 annual cash flow valued at an 8% discount rate is worth $125; at 9%, it falls to $111.11, an 11.1% decline. That is a stylized 100-basis-point sensitivity with no growth, not a forecast for any particular stock. Long-dated growth claims generally carry more rate sensitivity than near-term cash flow.
FX offers a further distinction. A surprise hawkish Fed message can support the dollar by widening anticipated yield differentials, but energy-driven inflation can also erode real returns or slow domestic demand. US yields, inflation expectations and peer central-bank rates must be read together. Why higher US inflation can strengthen the dollar explains that counterintuitive response more fully. The minutes alone do not establish the direction of the next currency move.
The December Decision Depends on New Evidence
The scheduled December 8–9 meeting creates an immediate information test. The BEA’s next PCE release, covering October, is scheduled for November 25; the November CPI release is scheduled for December 10, one day after the FOMC decision. Thus the committee will have the October PCE figures but not the November CPI report when it votes, barring changes to the published calendar. October payrolls were already available as the minutes were released. [4][5][10]
| Possible evidence before the decision | Interpretation if stronger | Interpretation if weaker |
| Core PCE and spending | Persistent price growth and consumption support the tightening case. | A softer sequential trend favors waiting, particularly with policy lags. |
| Labor and wage conditions | Firm demand reduces concern about immediate employment damage. | Abrupt deterioration may make a larger hike harder to justify. |
| Inflation expectations | Further deterioration raises credibility concerns. | Stable or declining expectations reduce one channel of persistence. |
| AI spending and credit conditions | Heavy capex keeps near-term demand pressure in focus. | Cancelled projects or credit stress change the growth-risk balance. |
The October minutes should not be interpreted as a December vote count. The phrase “almost all” describes the likely direction of policy under specified baseline assumptions, while the committee explicitly retained dependence on incoming evidence. Some participants thought a pause was a close call; others preferred action. It would be a mistake to translate that into a numerical market probability without observing traded contracts, their settlement definitions and their timestamps.
An evidence-based way to read the next decision is to distinguish three outcomes. A 25-basis-point increase delivered as widely anticipated is different from a 25-basis-point move paired with guidance that rates must remain high throughout 2027. A hold accompanied by evidence of cooling core inflation is different again from a hold necessitated by an abrupt financing shock. The action, accompanying forecasts and stated reasons matter together.
One thing the record does settle: the October hold was not a clean endpoint of tightening. It bought time while policymakers assessed whether inflation would stay elevated and whether the AI boom was a source of supply gains or additional demand and leverage. The next stage of the cycle may be decided as much by how those competing forces develop as by the arithmetic of one CPI release.

Johan Shamshad is Editor-in-Chief at Dave Finances, covering financial markets, digital assets, trading platforms, brokers, fintech, payments and regulation. Since 2023, he has also worked as an editor at Gulf News, the UAE English-language newspaper published by Al Nisr Publishing LLC. His work focuses on market-moving developments, company disclosures, regulatory changes and trading infrastructure, with an emphasis on primary-source verification and practical context for traders and investors.